Skip to content
Features

Everything in the box

No trial clock, no feature gate, no upsell — all of it, free. Here’s the whole thing, grouped the way the app is.

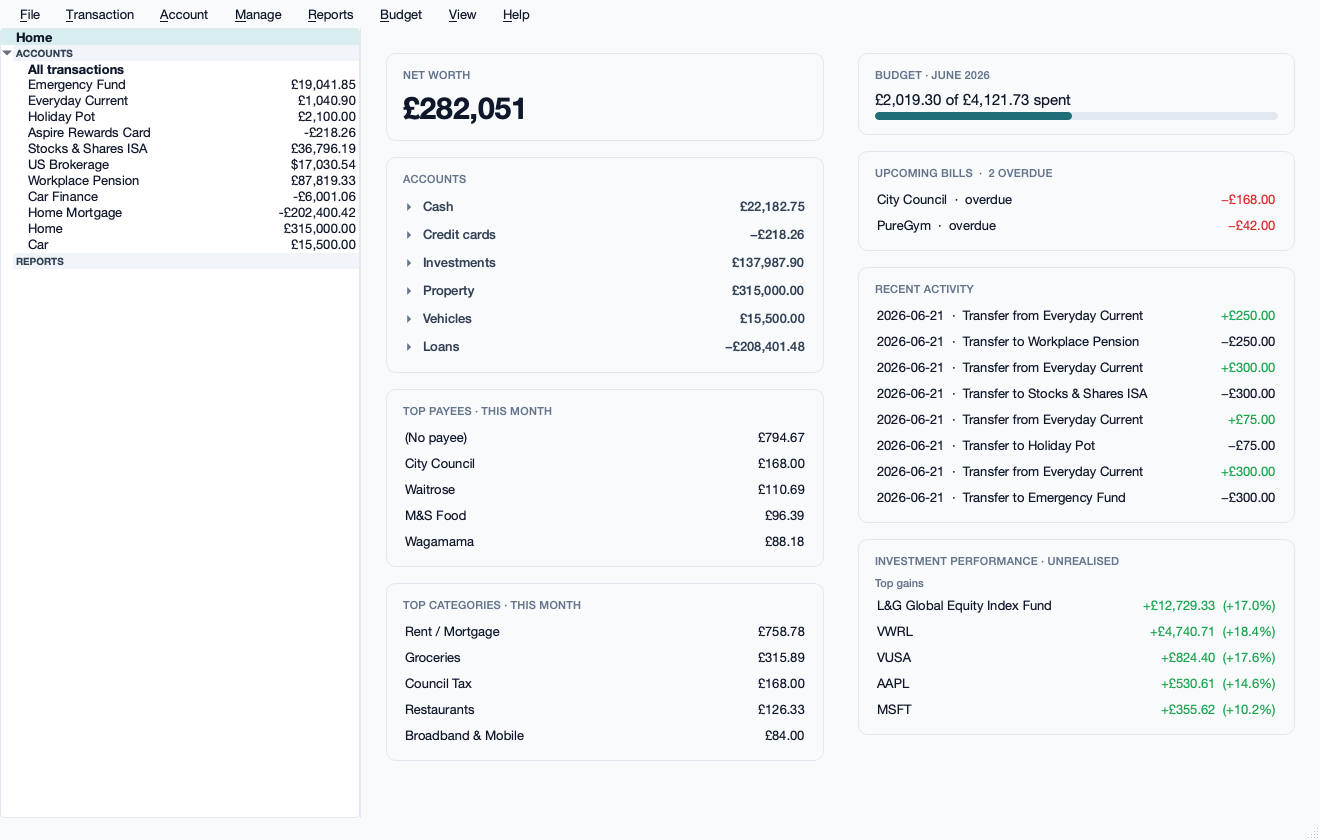
See everything at once

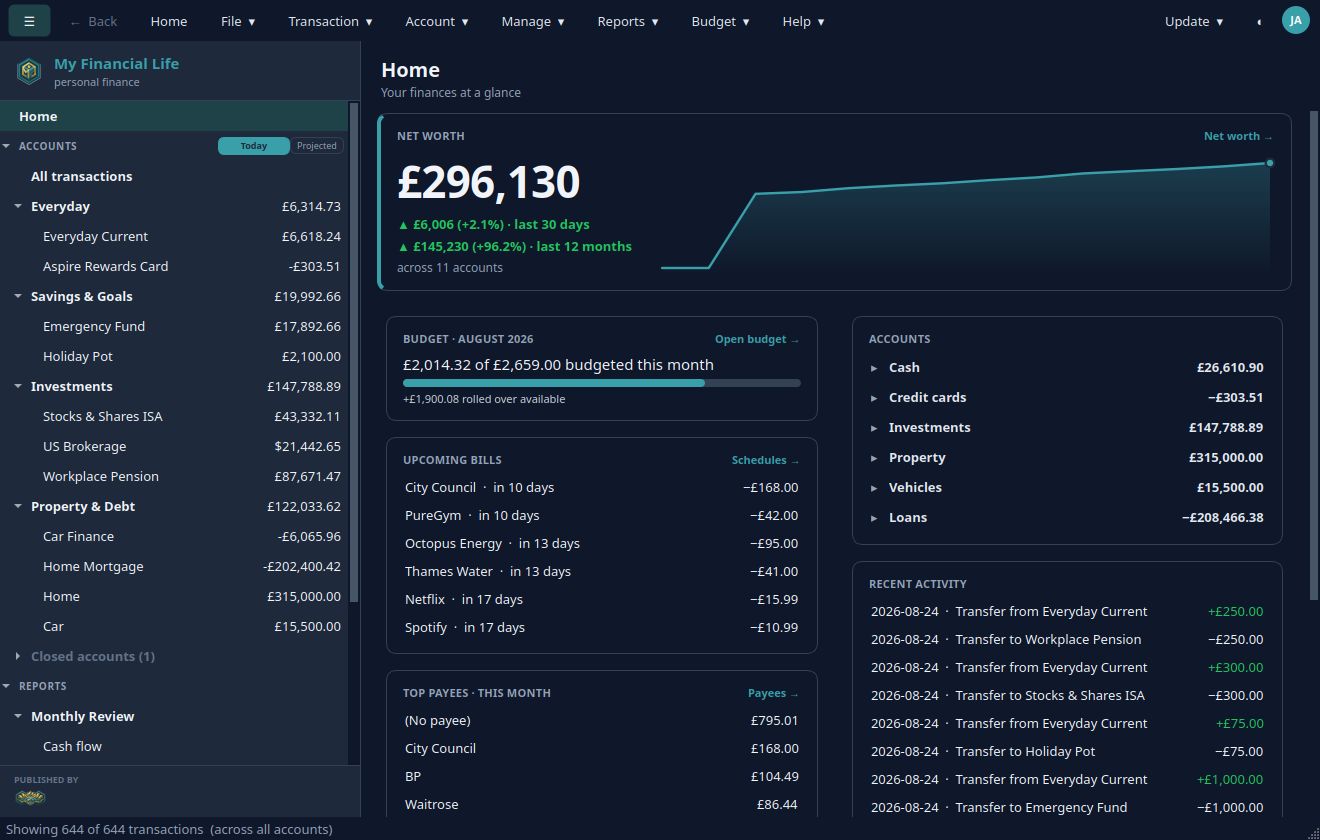
A home screen that answers the actual questions: what am I worth, am I on budget, what’s leaving my account this week, what just happened. Net worth carries a twelve-month trend, so a number becomes a direction.

  • Net worth & trend
  • Budget progress
  • Upcoming bills
  • Recent activity
The My Financial Life home dashboard showing a £296,130 net worth with a twelve-month trend line, budget progress, upcoming bills and recent activity.

Accounts & the register

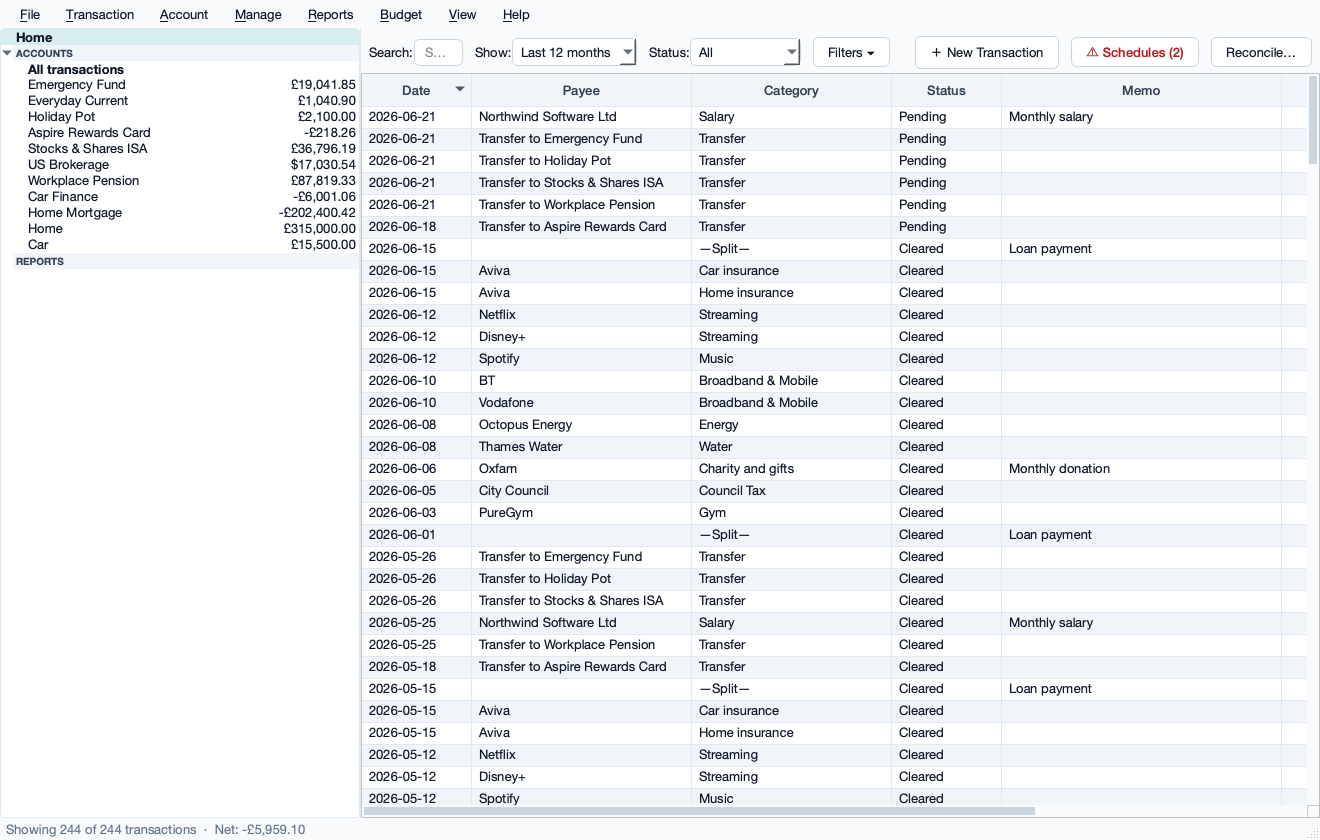
A familiar register with inline editing, typeahead payees, splits, and transfers that stay matched on both sides. Filter by date, amount, status or category — or open every account in one register and search the lot. Current, savings, credit and cash accounts sit alongside investment, property, vehicle and loan accounts.

  • Inline editing
  • Splits & matched transfers
  • All-accounts search
  • Running balances
A transaction register for a current account listing dated payees, categories, cleared status and a running balance.

Search everything

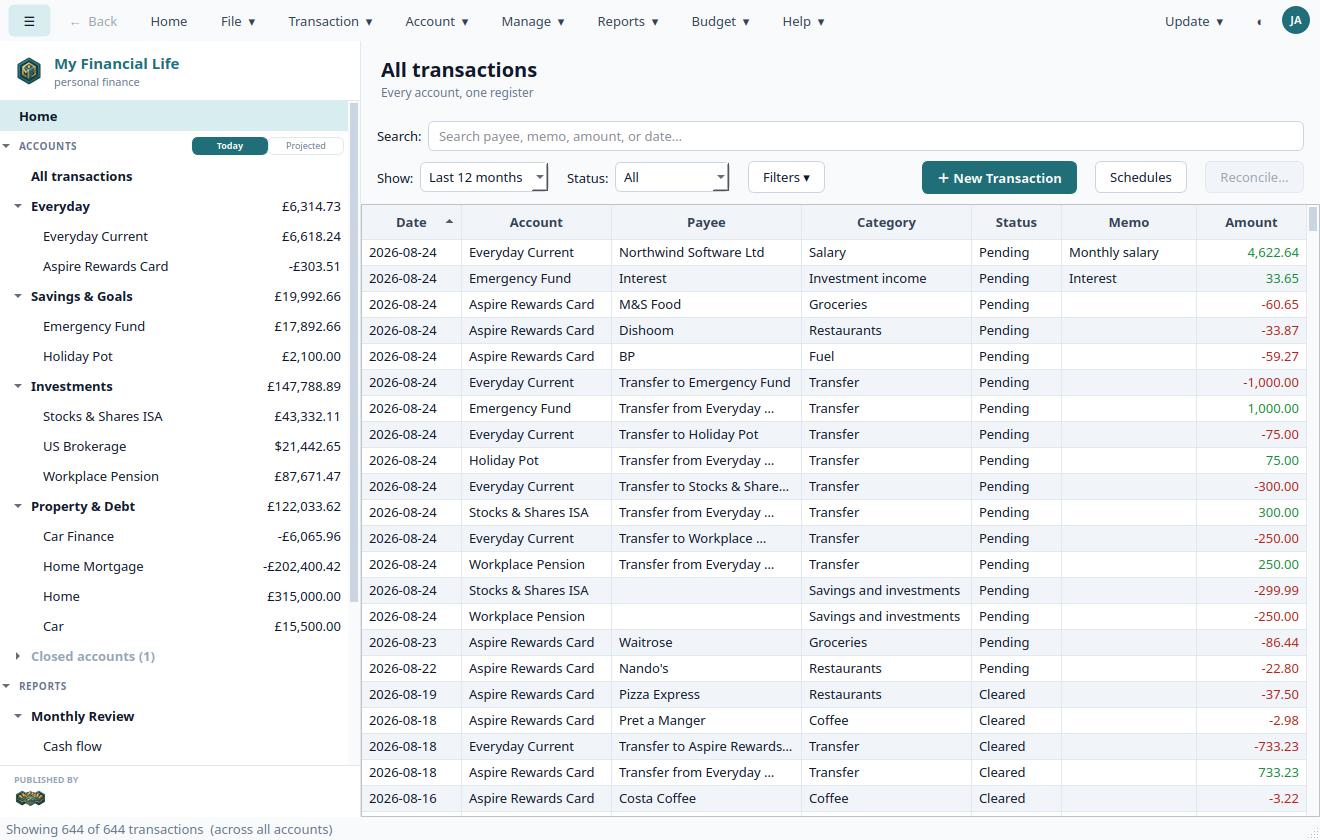
Every account in one place. Search 30,000 transactions and get an answer instantly, with an account column so you always know where a line came from.

  • Combined register
  • Instant search
  • Filter by anything
A combined register showing transactions across all accounts with an account column.

Import what your bank gives you

OFX, QFX, QIF and CSV, with a column-mapping wizard for any layout. The app remembers how you categorised each payee and applies it next time; a rules engine handles the rest.

  • OFX · QFX · QIF · CSV
  • Column-mapping wizard
  • Remembered categories
  • Rules engine

Coming Automatic bank downloads are in progress — pluggable providers, Enable Banking first.

Budgets you’ll keep using

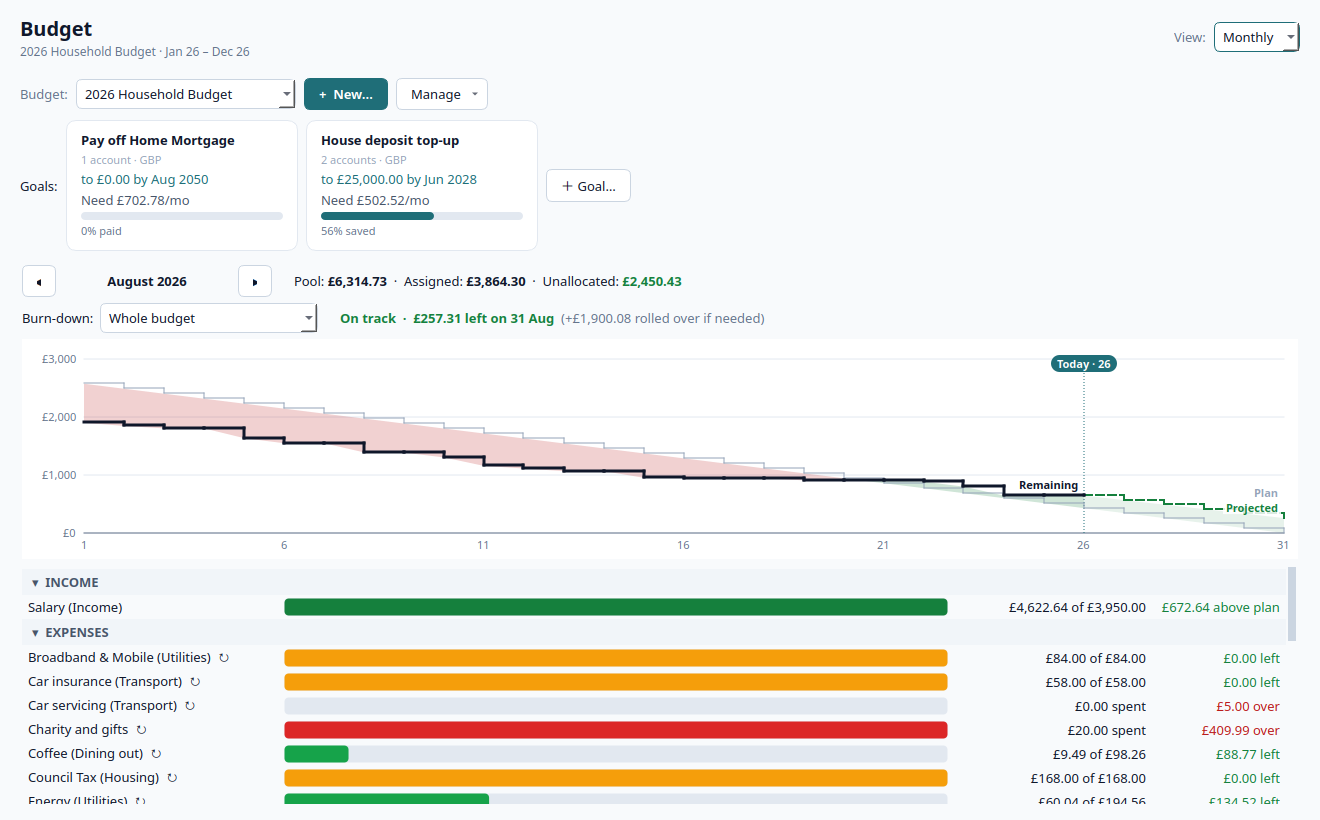
An envelope/zero-sum hybrid: assign what you have, roll over what you don’t spend. The annual matrix shows the whole year at once; the monthly view burns down against plan so you know on the 12th whether you’ll make it. Savings and pay-down goals sit alongside.

  • Annual matrix
  • Monthly burn-down
  • Rollover
  • Savings & pay-down goals
A monthly budget view with a burn-down chart against plan and per-category progress bars.

The year in one grid

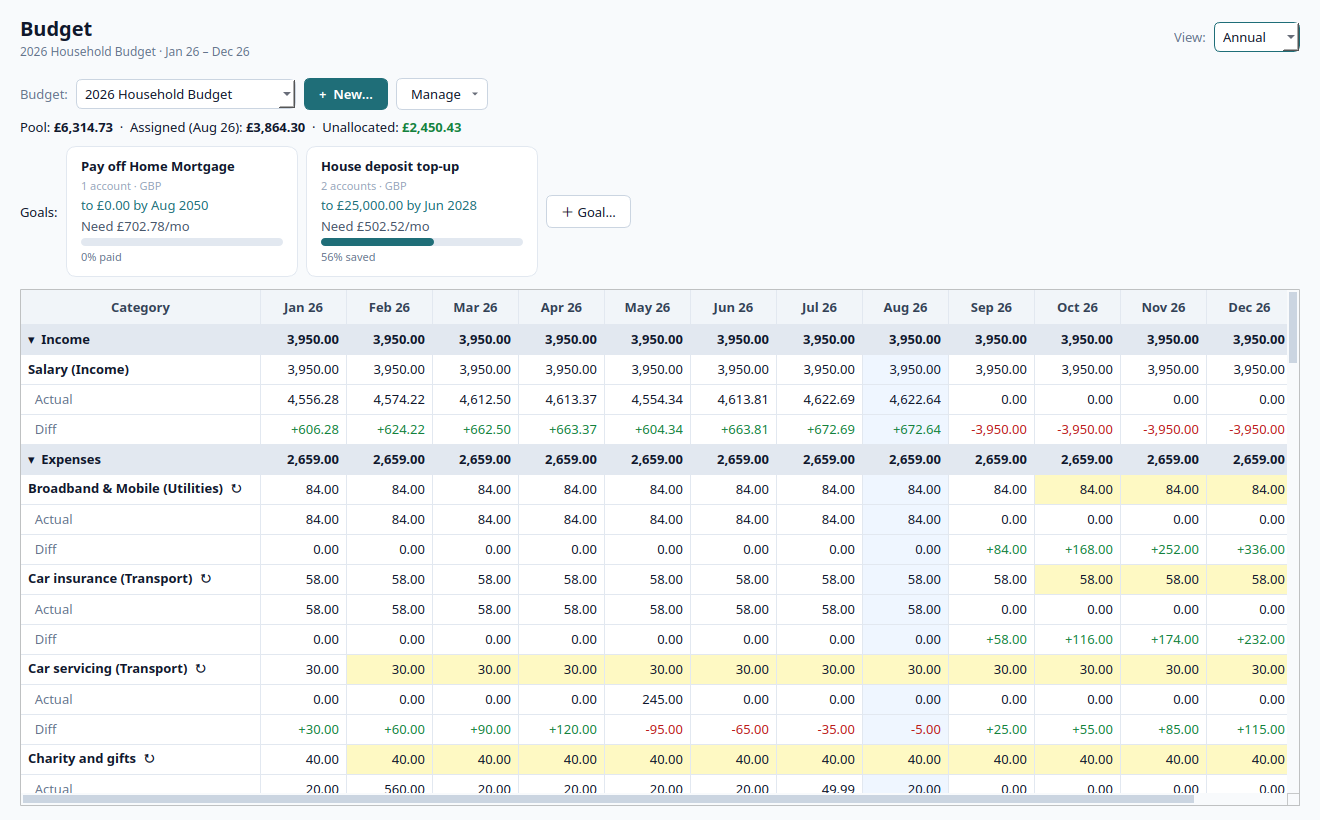
Planned, actual, and the difference — twelve monthly columns per category, editable in place.

  • Planned vs actual
  • Twelve months at once
  • Edit in place
An annual budget matrix with twelve monthly columns per category.

Investments with real numbers

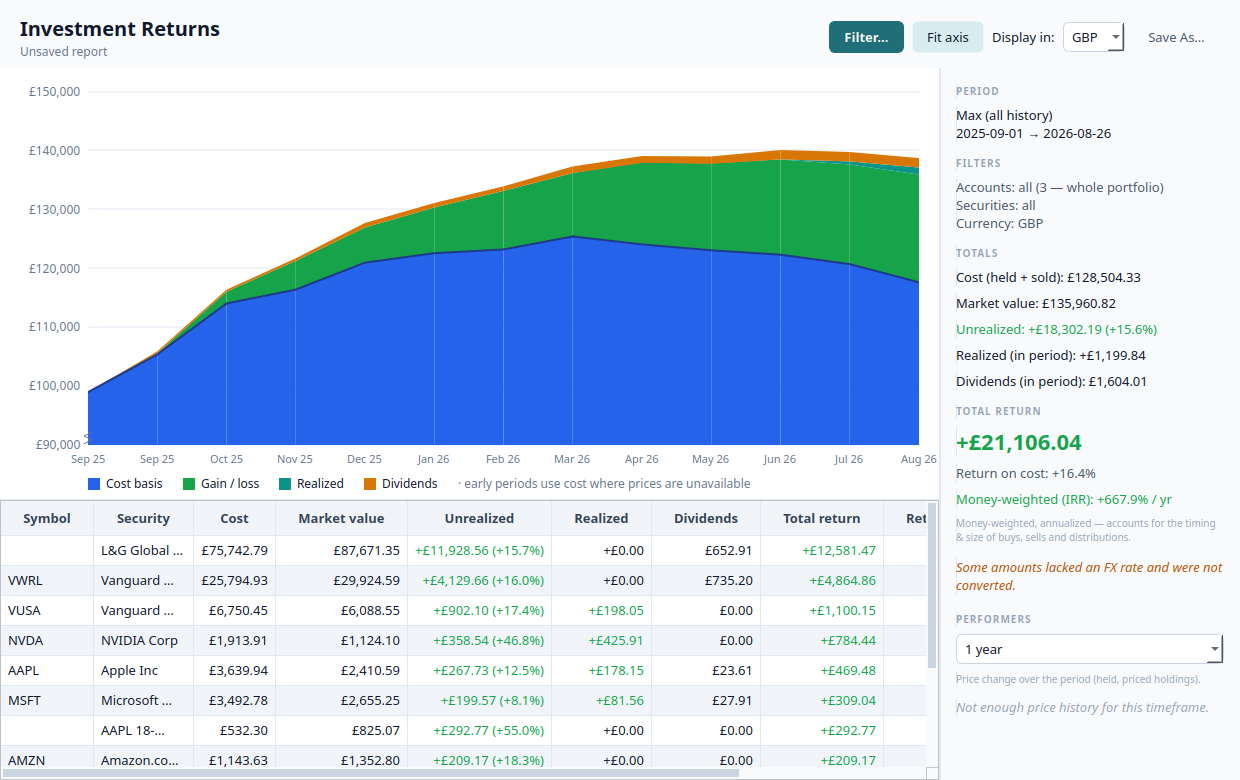
FIFO cost basis, realised and unrealised gains, dividends, splits and merges, bonds and options. Prices from Tiingo with your own key, or entered by hand. Returns as money-weighted IRR — not a percentage that flatters you.

  • True FIFO cost basis
  • Dividends, splits & merges
  • Bonds & options
  • Money-weighted IRR
An investment returns chart with cost basis and gain bands, beside a per-holding returns table.

Holdings, in detail

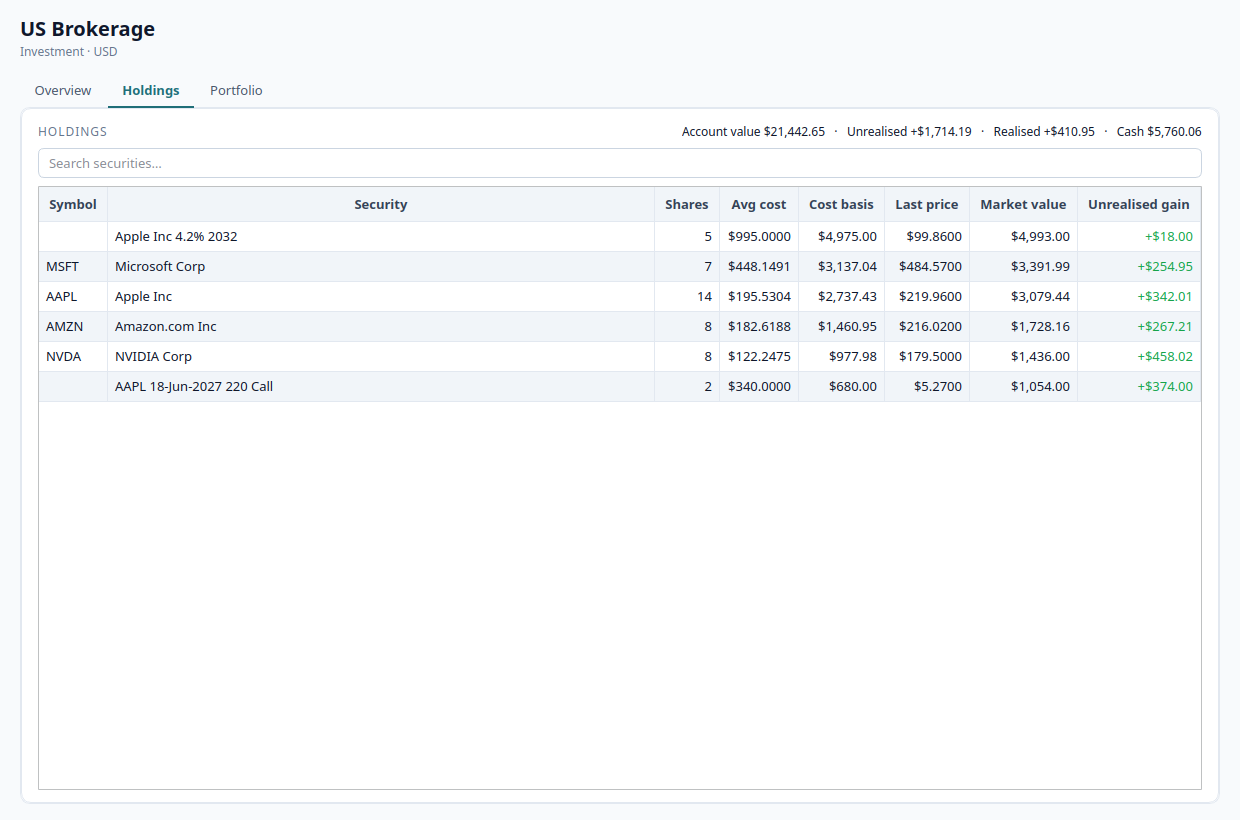
Every security with average cost, market value and unrealised gain — including the instruments most personal-finance tools quietly ignore.

  • Per-security detail
  • Average cost & market value
  • Unrealised gain
A holdings table listing shares, average cost, market value and unrealised gain per security.

Loans that tell the truth

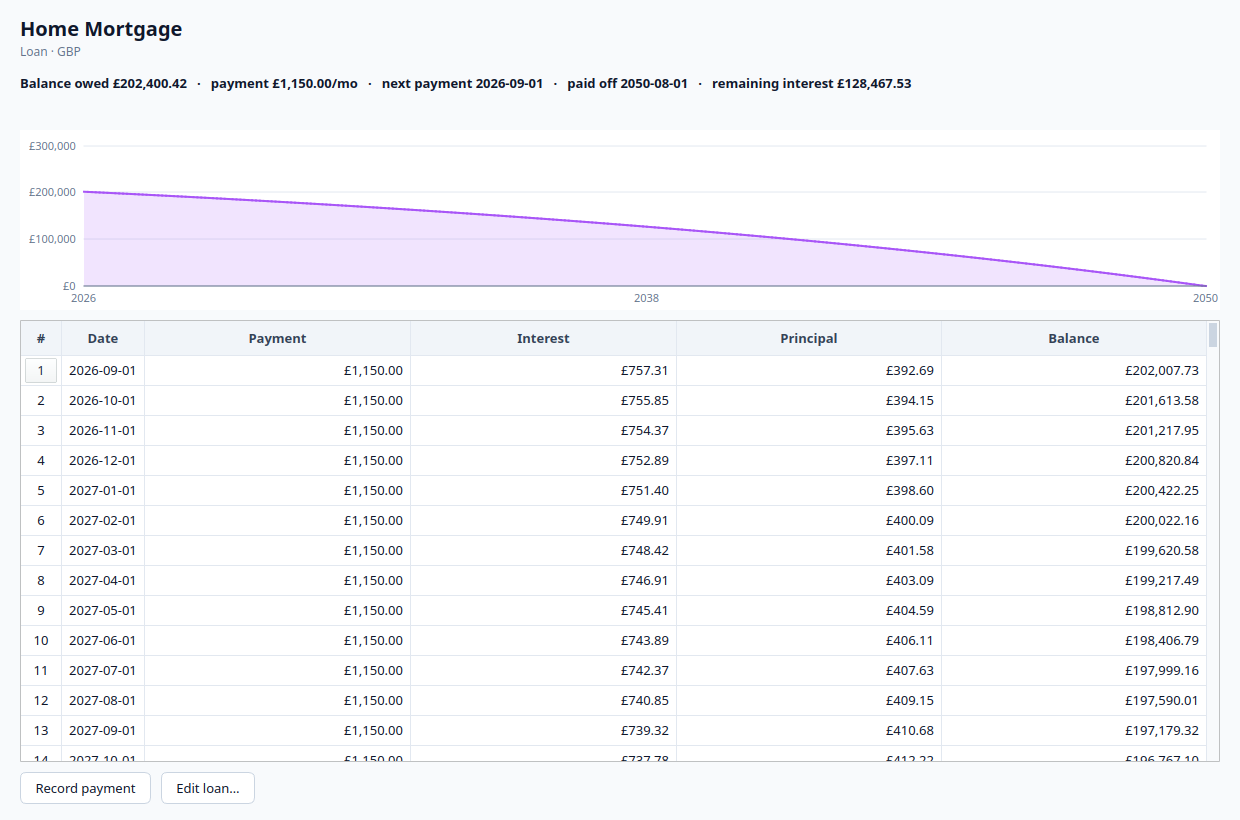
Amortisation from where the loan actually is now. Every future payment split into interest and principal, with the balance curve running to the final payment.

  • Amortisation schedule
  • Interest/principal split
  • Balance to the final payment
A mortgage amortisation schedule with a balance curve running to 2050.

Reports that answer questions

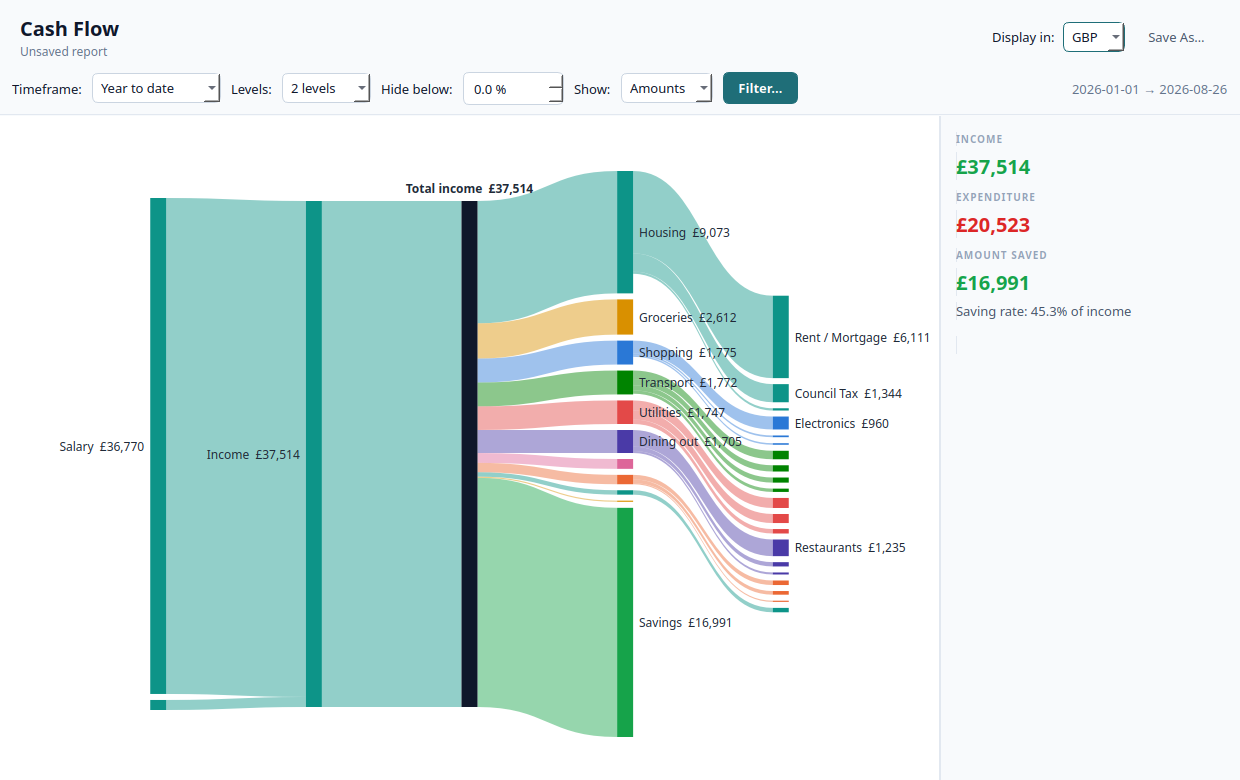
Net worth, the cash-flow Sankey, income vs expense, spending over time, by payee, by category × payee, investment returns and income. Drill into any figure to reach the transactions behind it, and save a report you’ll want again.

  • Cash-flow Sankey
  • Net worth
  • Income vs expense
  • Drill-through everywhere
A Sankey diagram tracing £37,514 of income through spending categories to £16,991 of savings.

Earned against spent

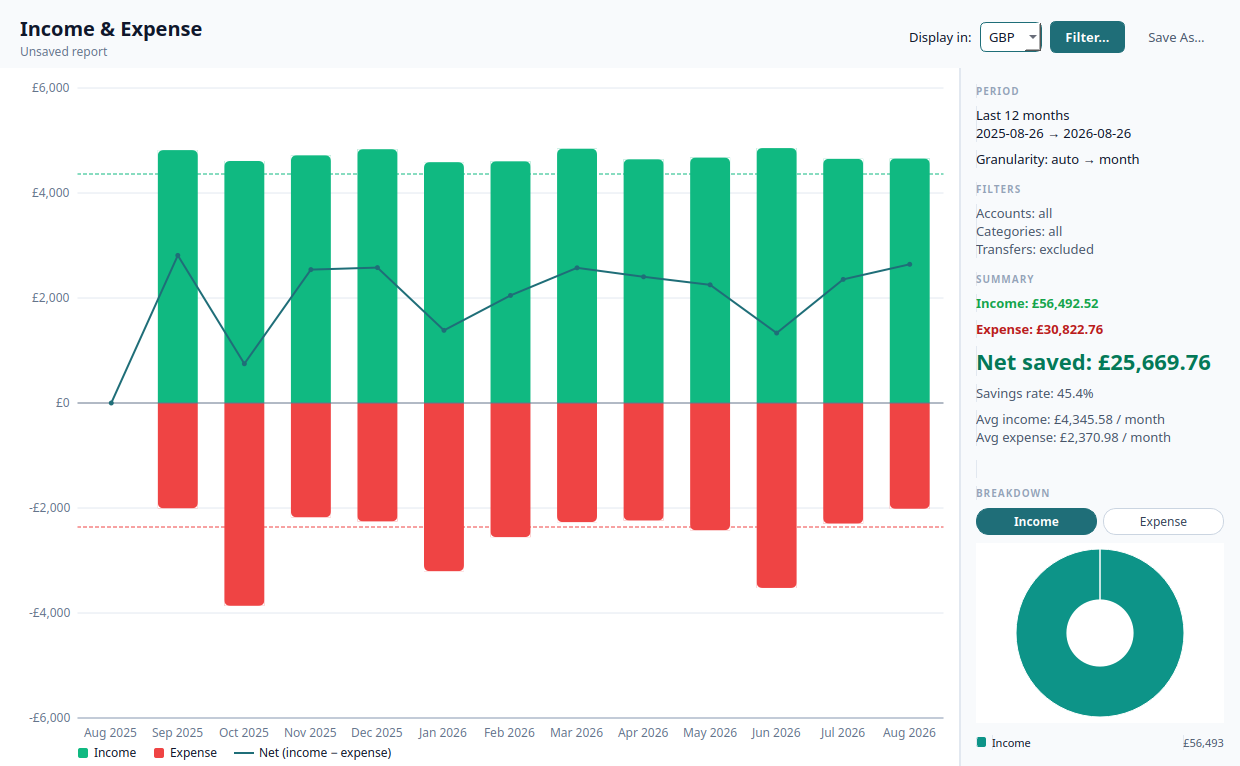
Income and expense month by month, with the net line on top — and the savings rate that falls out of it.

  • Monthly income & expense
  • Net line
  • Savings rate
A bar chart of monthly income and expense with a net line and a 45.4% savings rate.

Spending, in detail

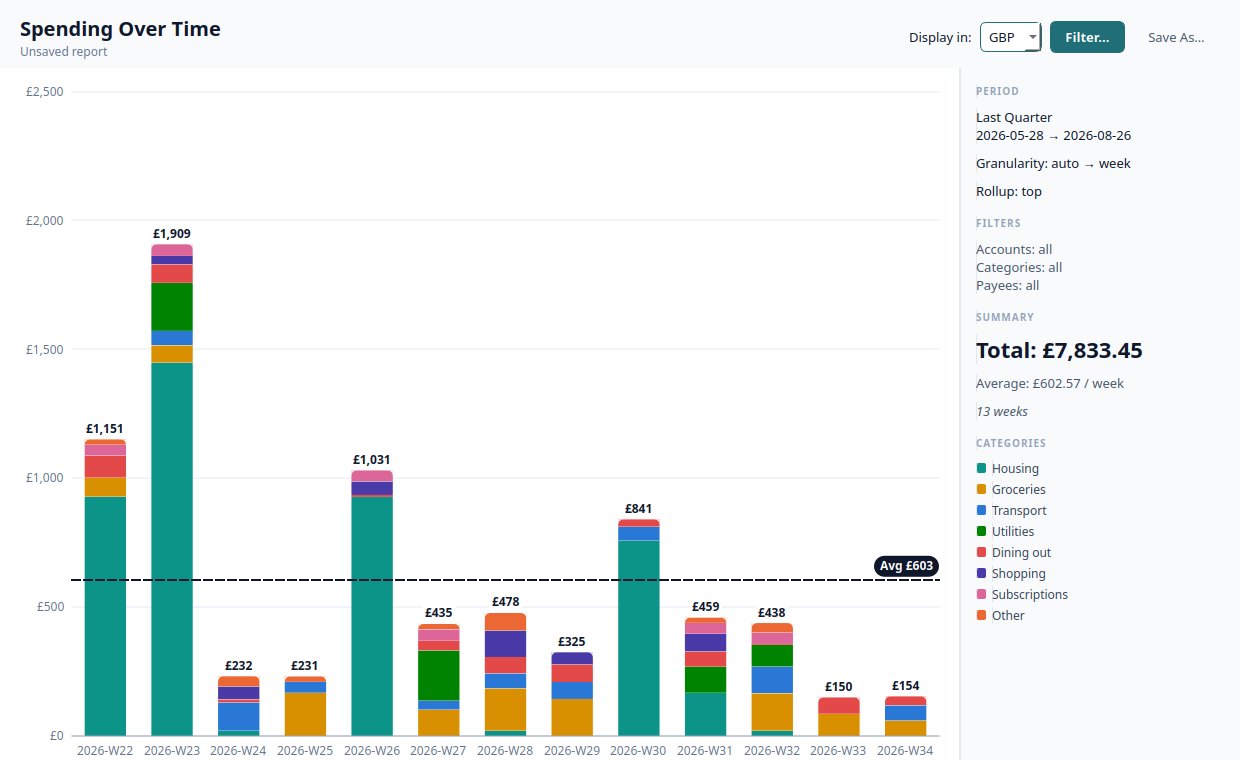
Spending by category over any period, measured against your own average rather than a stranger’s benchmark.

  • By category
  • Any period
  • Against your average
A stacked weekly spending column chart with category colours and an average line.

What you own and owe

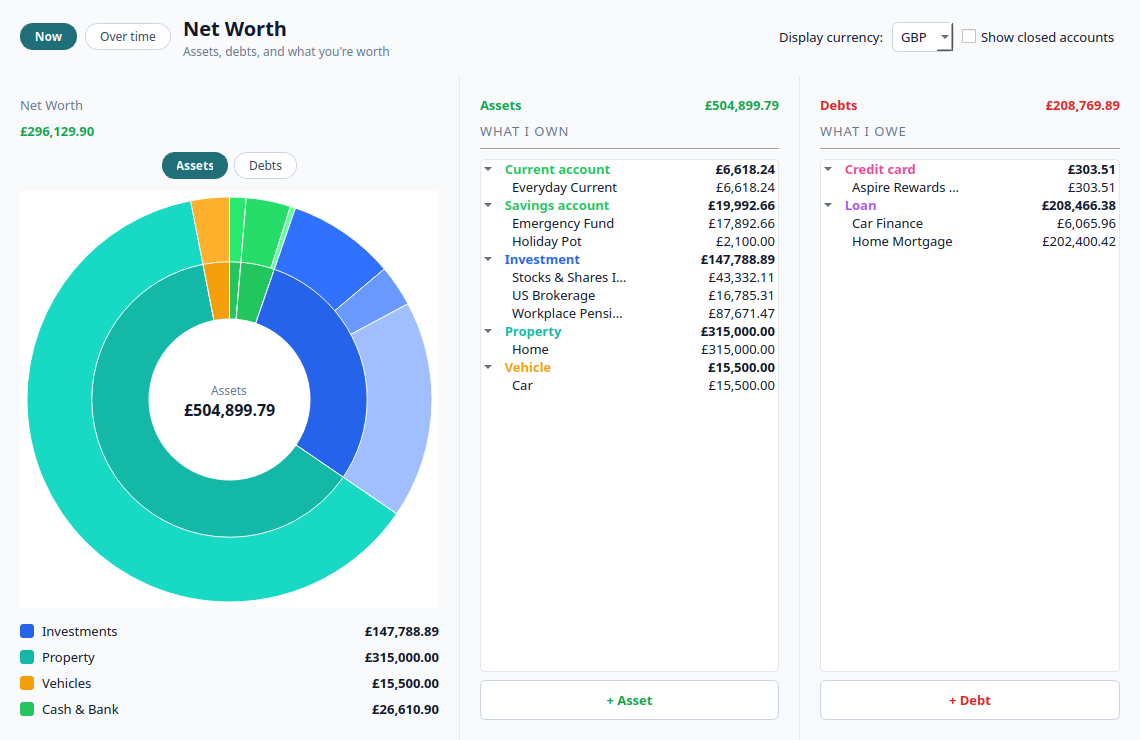
Net worth broken down or over time — assets against debts, itemised, with the gap between them.

  • Assets vs debts
  • Itemised breakdown
  • Over time
A net worth report with an assets donut chart beside itemised asset and debt columns.

Multi-currency throughout

Hold accounts in different currencies, with historical rates so last year’s numbers stay correct. Convert any report to whichever currency you think in.

  • Accounts in any currency
  • Historical FX
  • Convert any report

Your file, your disk

One .mfl file, plain SQLite, auto-saving as you work, with rotating snapshots. Kept in ~/Documents/My Financial Life/ and untouched by installs and upgrades. If the project vanished tomorrow your data would still open.

  • Plain SQLite
  • Auto-save
  • Rotating snapshots
  • Survives uninstall

Light and dark

One type scale and one set of design tokens across every screen, in both themes — not an inverted afterthought.

  • Both themes
  • One design system
  • Big legible numbers
The My Financial Life home dashboard in dark theme.

Every feature, free.

GPL-3.0, for 64-bit Linux — a Debian/Ubuntu package, a portable AppImage, or a tarball for any distribution.